Imaging FCS excites fluorescence in a cross-section of a sample. The cross-section is then imaged onto a camera or array detector, which records the data at high speed. If the cross-section is sufficiently thin (<1 µm), the camera sufficently fast (~1 ms per frame or faster) and the pixels on the order of the diffraction limit, the observation volume of each pixel is sufficiently small and the time resolution sufficiently fast to detect single molecule fluctuations and calculate ACFs for each pixel.
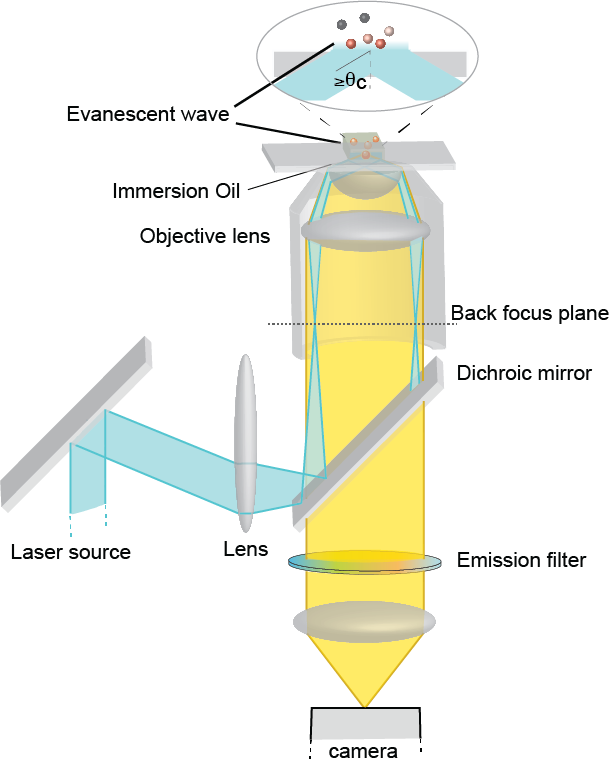
In Imaging Total Internal Reflection FCS, or ITIR-FCS, this is achieved by illuminating a thin section above the coverslip (~80-200 nm). Molecules within this evanescent wave can be excited and imaged onto a fast camera. A time resolution of ~1-2 ms is typically sufficient to observe lipid membrane diffusion. A time resolution of ~0.1 ms is sufficient to observe protein diffusion in the cytosol (note that exact values for the time resolution will depend on the pixel size and PSF, and thus on the observation volume).
The ACFs in imaging FCS exhibit the same general characteristics in terms of amplitude and width as confocal ACFs. However, their functional form and shape is somewhat different. This is a result of the fact that in imagign FCS the exciation intensity in the focal plane is constant and the intensity ditribution on the camera is a result of the point spread function (PSF) of the setup. The pixel observation volume is thus a convolution of the pixel with the PSF of the setup.
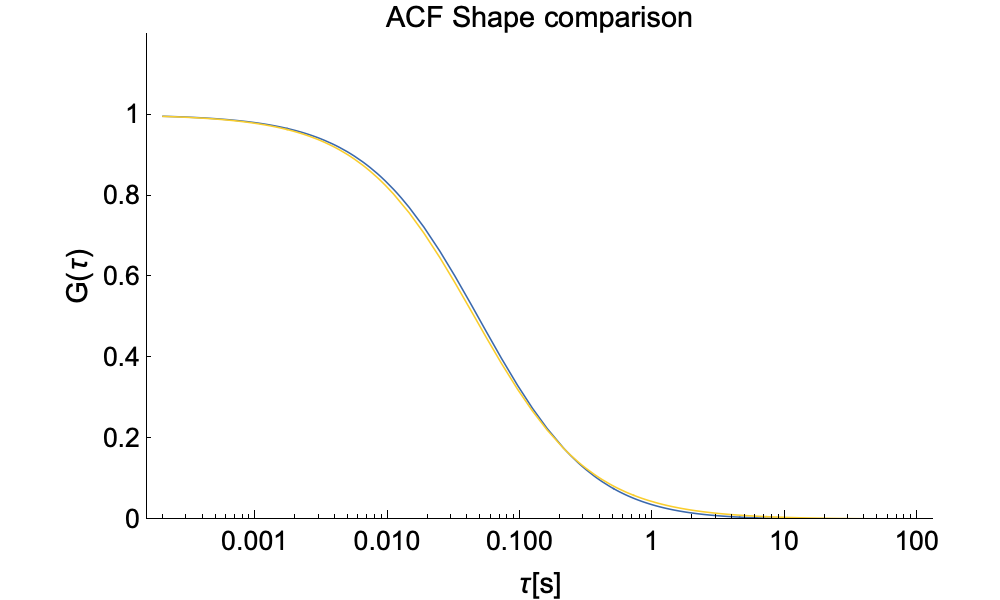
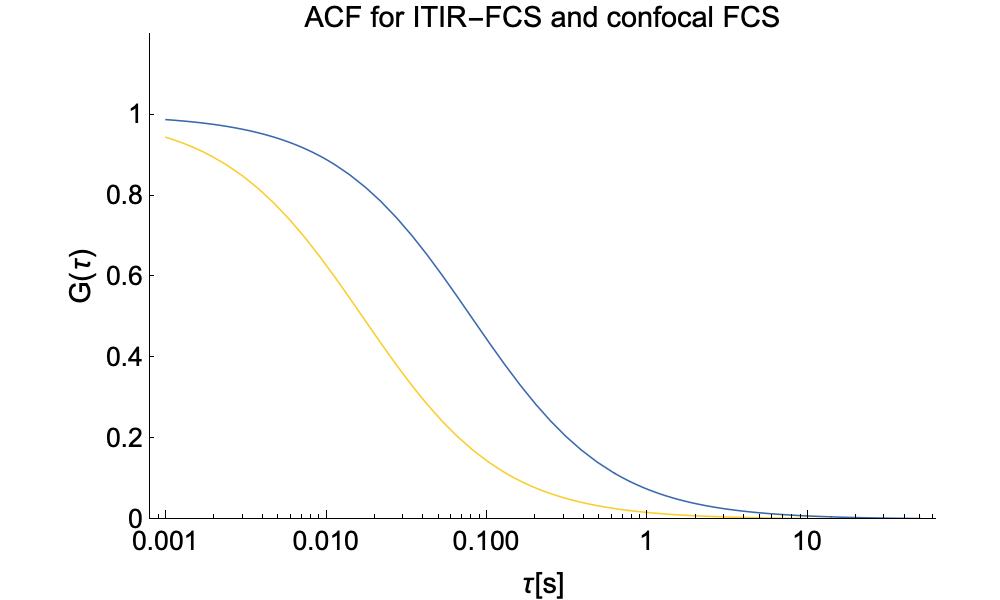
In the graph on the top above one can see the subtle differences in the shape of the ACFs for confocal (yellow) and ITIR-FCS (blue). On the bottom graph we show ACFs for confocal and ITIR-FCS with typical setup parameters for each technique. The ITIR-FCS curve is wider, although it measures the same particle with the same diffusion coefficient, as the observation volume in imaging FCS tends to be larger. Also note that in imaging FCS, the diffusion coefficient D is directly uesd as a fit parameter as the pixel size is exactly known, the intensity is conatnt in the focal plane, and the PSF for an optical system is easily measured. This has the advantage that in imaging FCS no extra calibrations are needed once the PSF of the optical system has been determined.
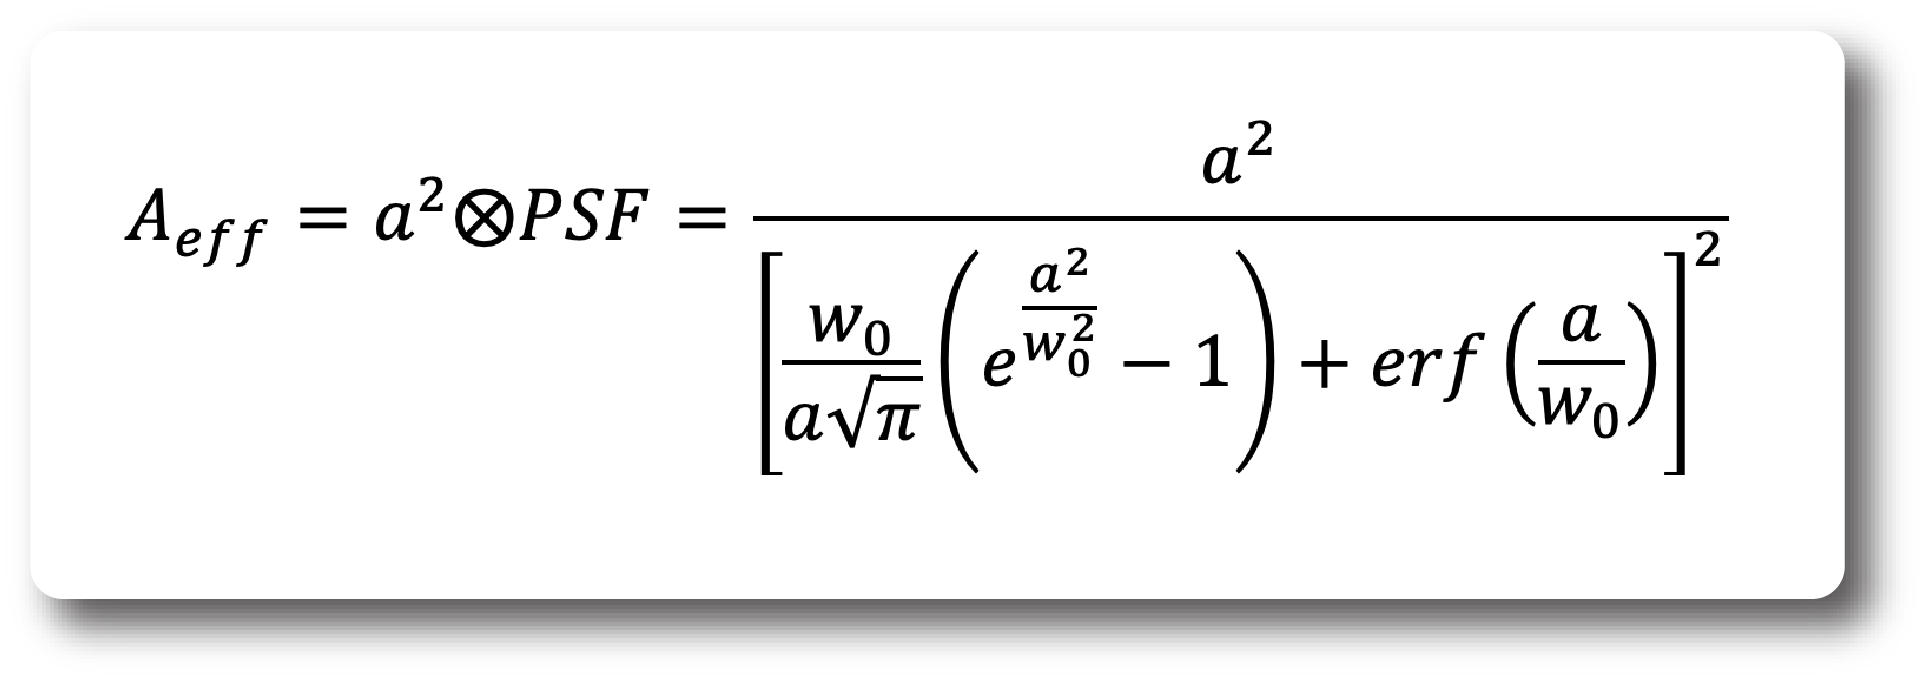
The effective observation area in Imagign FCS is given by:
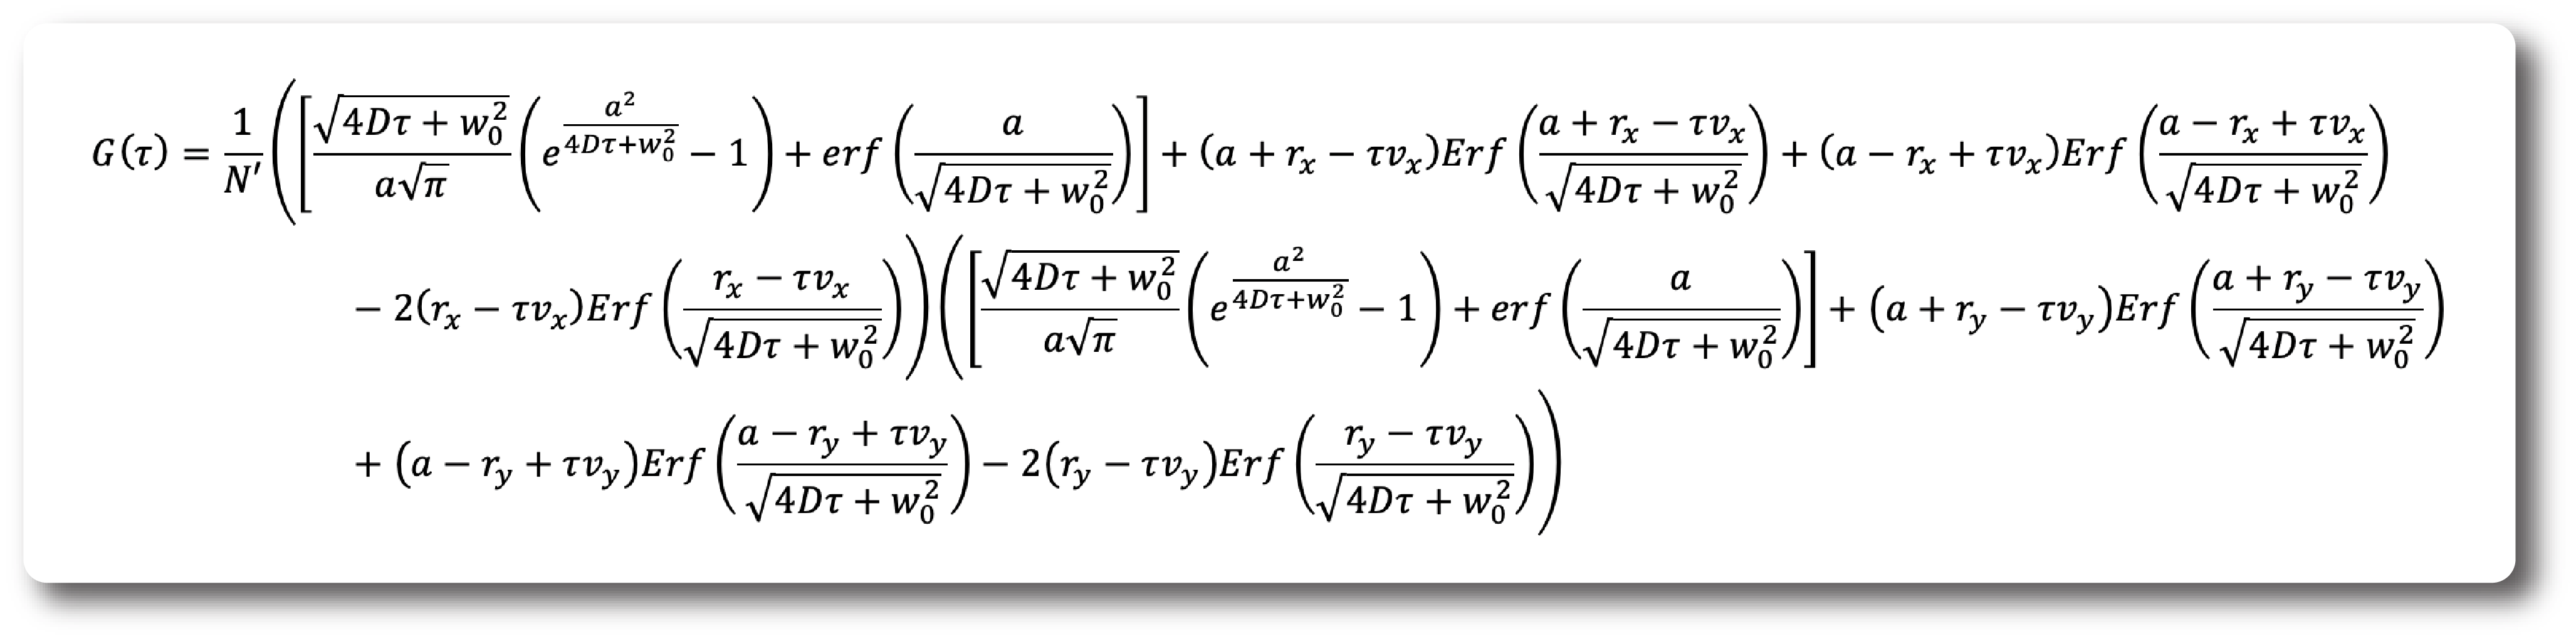
And the ACF for ITIR-FCS is given by:
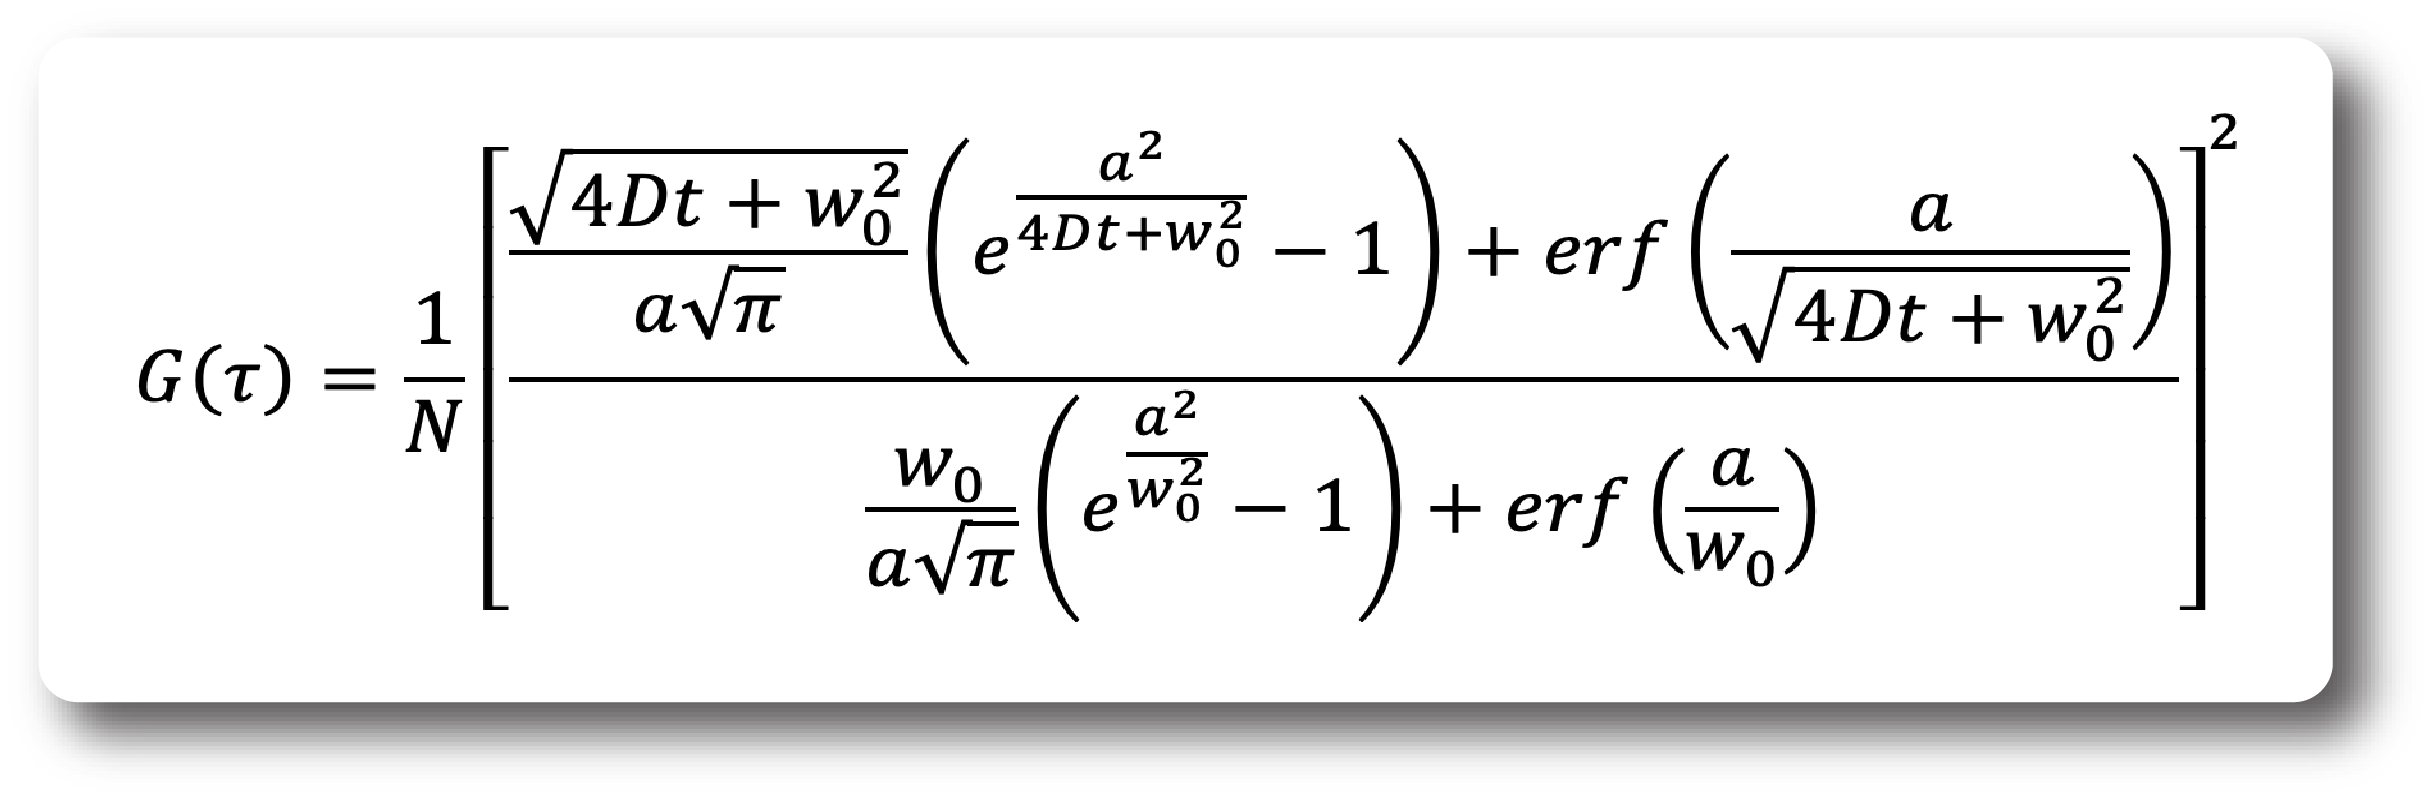
Note that we assume that there is no movement in the z-direction and we assume pure 2D diffusion. This is typically fulfilled when measuring on membranes. Otherwise, if movement in the z-direction needs to be accounted for then one needs to include an ACF component for movement along the exponentially decaying field in that direction.
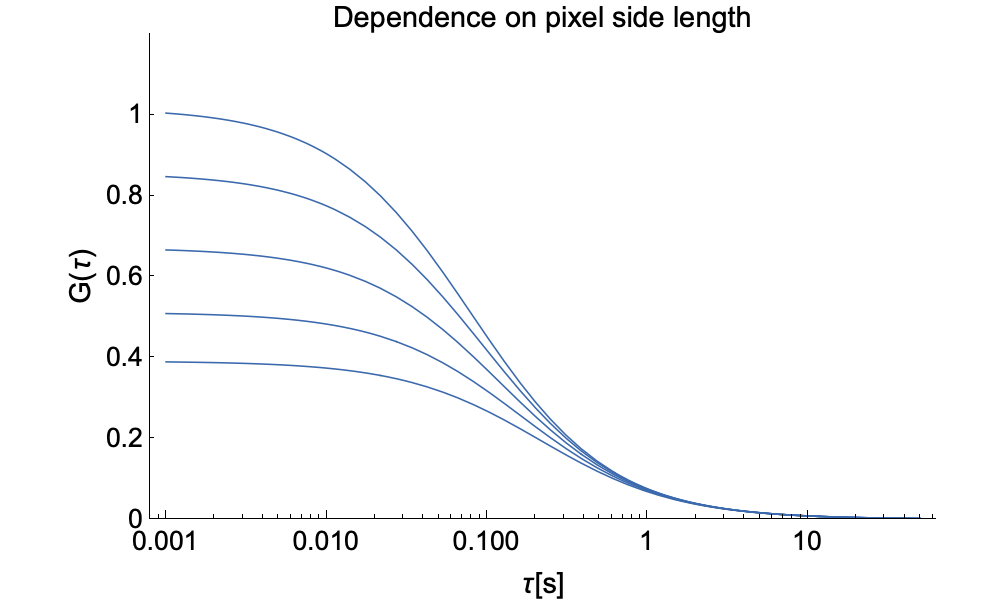
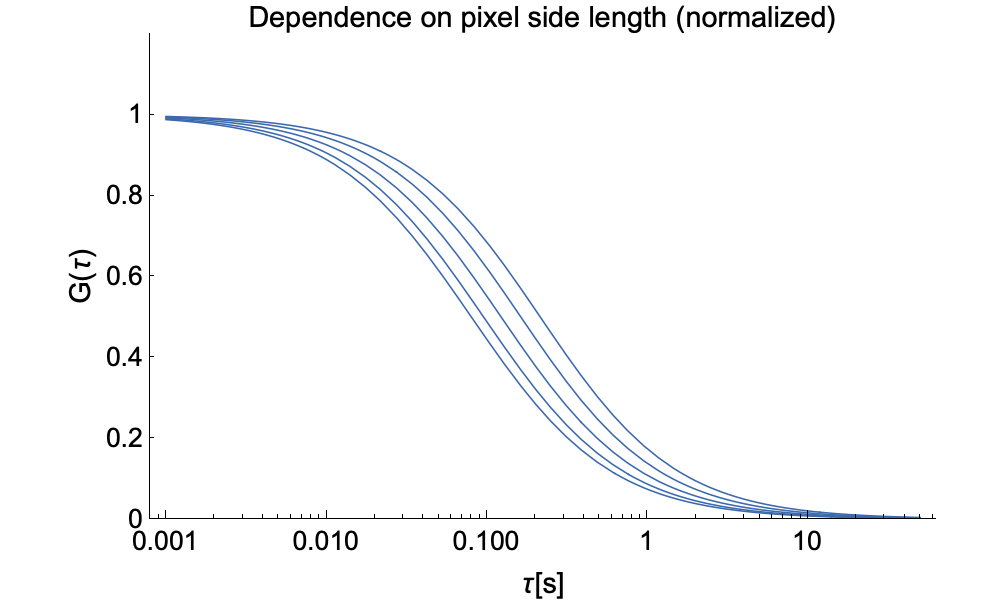
On cameras we acquire an array of contiguous pixels. This allows measuring many ACFs simultaneously, but also to bin pixels for the measurment of FCS diffusion laws, improve signal to noise ratio, or extend the time a particle spends in the observation volume to capture more features of the ACFs. The images below show how the ACF in ITIR-FCS changes with pixel size. On the left one can see how the amplitude decreases with pixel size as more particles are recorded. On the right we have normalized the same functions to show how the width increases with pixel size as particles need more time to cross the observation volume.
A further advantage of imaging FCS is that we can now also measure spatial cross-correlations between pixels. In the graphs below we depict raw ACFs on the left and (peak-) normalized ACFs on the right for pixels of different distance. This demonstrates that the number of particles diffusing from one pixel to another decreases with distance and thus the ACF drops. Although the pixels individually see the same number of particles, a smaller and smaller fraction is correlated between pixlels when the distance between them increases. The right side shows that the cross-correlation peak moves to longer time with inter-pixel distance as particles need longer to diffuse from one pixel to the other.
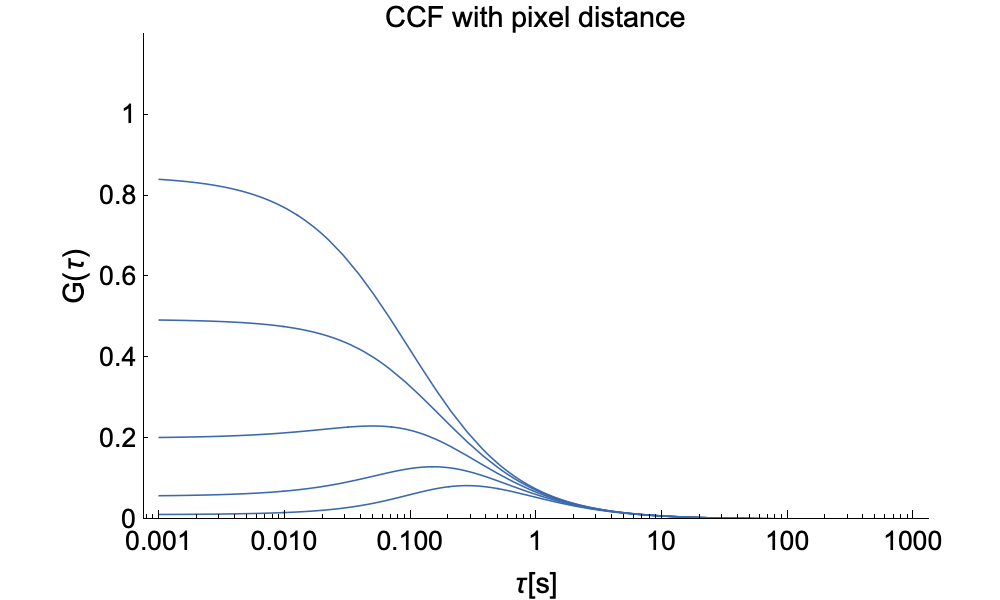
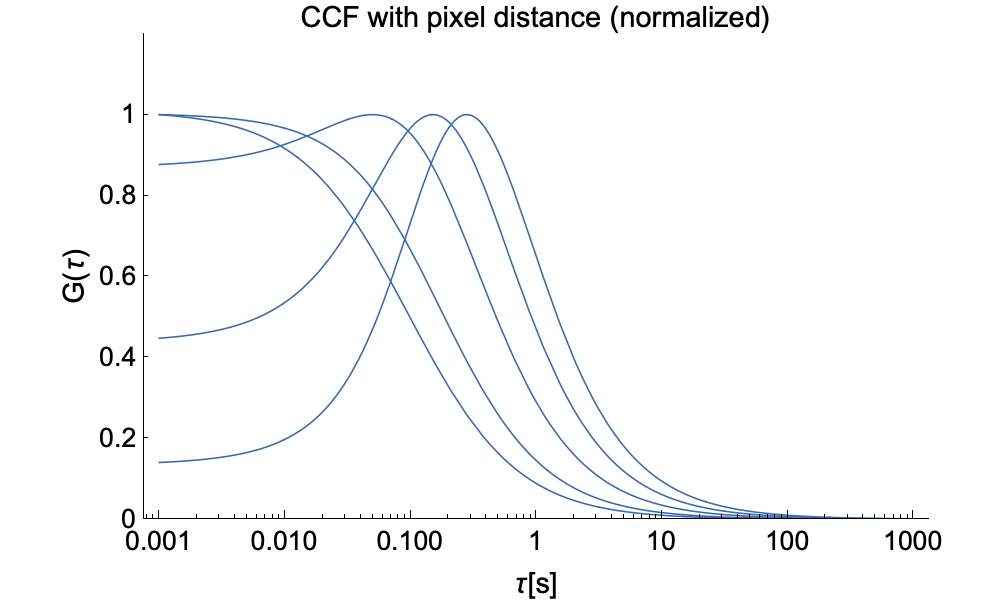
The spatial cross-correlation function (CCF) in ITIR-FCS, including diffusion, flow, and the distance between the pixels to be cross-correlated in x-, and y-directions, is: