Measurements in tissues and organisms
Firstly, measurements in cells are often performed under over-expression of proteins of interest. This can lead to changed interaction patterns and physiological effects (compare, for instance, the different expression levels of proteins in cancerous and non-cancerous cells). Therefore, we need to develop techniques that can measure biomolecular interactions at physiological expression levels.
Secondly, measurements are often performed in 2D cell cultures. However, these conditions do not reflect the actual three dimensional organization of organisms and crucial cell-cell interactions are not well replicated. Thus, it is important to develop methods that can measure biomolecular functions and interactions in a three dimensional context of 3D cell cultures, tissues, or whole living organisms.
Thirdly, many spectroscopy methods which allow quantitation of biological interactions in vivo are restricted to single point measurements. Therefore, there is a need to multiplex existing techniques and develop imaging spectroscopy techniques that allow the quantitative analysis of every single point in an image with good spatial (diffraction limited) as well as good temporal resolution.
The most sensitive biophysical tools to date are fluorescence microscopy and spectroscopy which are routinely applied in cells and can have single molecule sensitivity. Therefore, recently several attempts have been made to a) bring fluorescence spectroscopy into living organisms, and b) provide imaging capabilities for spectroscopy to allow simultaneous measurements of biological processes in the complex 3D structure of living tissues with good temporal and spatial resolution.
We have developed four new fluorescence techniques called Single Wavelength Fluorescence Cross-correlation Spectroscopy, Imaging Total Internal Reflection Fluorescence Correlation Spectroscopy, Line scan FCS, and Single Plane Illumination Microscopy Fluorescence Correlation Spectrscopy which address at least some of these issues. SW-FCCS can quantitatively measure biomolecular interactions with single molecule sensitivity in cells and organisms. ITIR-FCS on the other hand is a spectroscopic imaging technique which provides good spatial (diffraction limited) and temporal (~0.3 ms) time resolution. Line-scan FCS provides a tool to measure flow profiles with good spatio-temporal resolution in organisms (e.g. in the zebrafish vascular system). SPIM-FCS is capable of performing multiplexed measurements in cells and organisms (e.g. blood flow in zebrafish). By using state-of-the-art fluorescence techniques we hope to help elucidate biomolecular interactions under physiological relevant conditions and connect some molecular events to macroscopic effects, e.g. the development of organisms.
Extracellular interactions and ligand degradation shape the nodal morphogen gradient
Morphogens are known to dictate developmental pattern formations by forming morphogen gradients in space which play a key role in embryo development. These molecules are known to spread across space via diffusion and activate key development related signaling pathways at specific spatial and temporal points. Nodal factors are a class of morphogens, specifically signaling ligands are responsible for the mesendoderm induction and embryonic axis formations. The question of how does the morphogen gradient form for the nodal factors- squint and cyclops is discussed here. It has been known that squint gradient spans across a larger length than cyclops. Using Confocal Fluorescence Correlation Spectroscopy [10], we find that diffusion coefficients of these nodal ligands are very similar. This implies the fact that diffusion itself isn’t enough to explain different gradient ranges. Using Fluorescence Cross Correlation spectroscopy (FCCS), we measure the binding affinities between molecules. We also see that squint has a larger binding affinity for activin cell receptors than cyclops. It also has a higher binding affinity to its antagonist lefty. This would mean that squint should have a shorter gradient range.Instead when we measure the degradation rates, we find that squint also has a higher stability than cyclops over time. This fact explains its long gradient range. This fact is reestablished when we replace the lysozyme targeting domain of squint with cyclops, we see a reduced gradient range. If we remove the cyclops’s lysozyme targeting domain, we see an increased gradient range. The gradient formation is thus an interplay of multiple processes - production rates, diffusion, binding, release and degradation rates. It would be interesting for future studies to see how these molecules interact with other factors in the extra cellular environment and also find out what exactly slows down these molecules while the gradients form in space.

A: Representative image and region of interest (red rectangle) to measure gradient distribution; lower, inset showing magnified region of interest. B: Normalized fluorescence intensity distribution profiles over space and fitting. Error bars indicate standard error of mean (s.e.m). C: Gradient ranges for different nodal constructs. Sqt: Squint, Cyc: Cyclops, SqtCyc2 : Squint with cyclops’ lysozyme targeting domain and CycΔ2: Cyclopsmutant construct without the lysozyme targeting domain. EGFP: Enhanced Green Fluorescent Protein
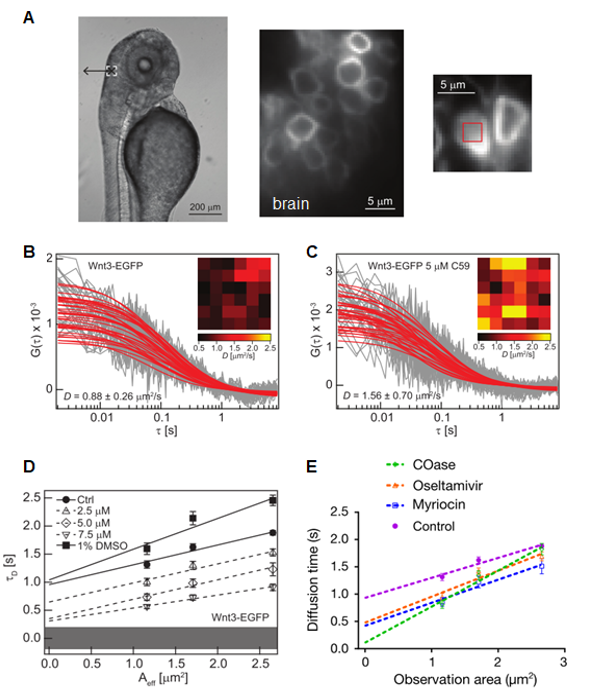
SPIM-FCS measurements of Wnt3-EGFP transgenic zebrafish detect increase Wnt3-EGFP diffusion in the plasma membrane after targeted drug/ enzymes pretreatments

A) The wnt3 promoter-driven zebrafish transgenic line, Tg(-4.0 wnt3:Wnt3EGFP) expresses functional Wnt3EGFP in the brain.(B) The FCS diffusion law applied to SPIM-FCS data localize Wnt3-EGFP in cholesterol-dependent domains. (C) Inhibition of Porcupine by pre-treatment with 5µM C59 inhibit palmitoylation of Wnt3-EGFP reduces the extent of domain confinement and led to an increase in D of Wnt3-EGFP. The overall increase in the membrane diffusion of Wnt3EGFP is also reflected in the spatial distribution of D from the D maps before and after treatment with C59. (D) Control Wnt3-EGFP was confined to the plasma membrane domains with a positive t0 value of 0.88 ± 0.13 s. Increasing C59 dosage decreases t0 which indicates that membrane-bound Wnt3-EGFP become less confined in membrane domains. (E) Domain-like diffusion was almost completely abolished in COase-treated embryos, leading to free diffusion. In myriocin- and oseltamivir-treated embryos, domain confined diffusion was reduced significantly.
This study [11] shows that the domain-like hindered diffusion of Wnt3 is dependent on ordered membrane lipids and is necessary for its signalling activity.

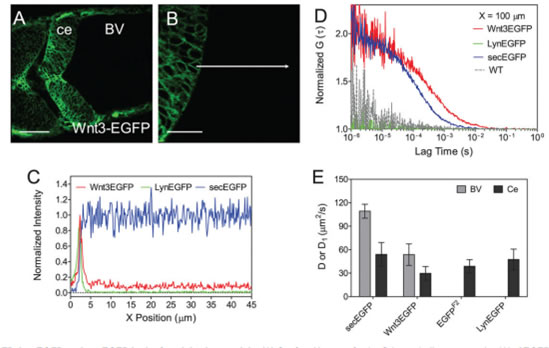
For instance, here we study the dynamics of Wnt3, Lyn and Sec in zebrafish cerebellum [8]. (A) Confocal image of zebrafish cerebellum expressing Wnt3EGFP at 34 hpf. Scale bar: 50 μm. (B) Zoom of A at 3× magnification with focus on the cerebellum boundary and flanking brain ventricle. Scale bar: 20 μm. Images were taken in dorsal view. BV, brain ventricle; ce, cerebellum. The images were modified using Imaris to increase the contrast. (C) Normalized fluorescence intensity from the cerebellum boundary cell to the brain ventricle along the white arrow in B of Wnt3EGFP (red), LynEGFP (green) and secEGFP (blue). Data are the average of three scans of three embryos for each type to the highest point. (D) Normalized ACF curves taken within a ventricle at 100 μm from the cerebellum boundary. Color-coding is the same as in C together with wild type (WT, dotted gray). The results show the free diffusion of Wnt3EGFP and secEGFP in the brain ventricle, whereas no fluorescence can be detected either for LynEGFP or for WT. (E) Diffusion coefficients extracted from fit for different types of EGFP-labeled proteins in both the cerebellum and the brain ventricle. secEGFP serves as an intercellular indicator of protein mobility in multicellular tissue and extracellular indicator in the brain ventricle. EGFP reporter Tg(-4.0wnt3:EGFP)F2 and LynEGFP transgenics Tg(-8.0cldnB:lynEGFP) serve as an indicator of intracellular protein mobility. Data are mean±s.d. Light gray bar, brain ventricle (BV); dark gray bar, cerebellum (ce).
Reference:
[1] Pan, X.; Yu, H.; Shi, X.; Korzh, V.; Wohland, T. Characterization of flow direction in microchannels and zebrafish blood vessels by scanning fluorescence correlation spectroscopy, J Biomed Opt, 12 (2007) 014034.
[2] Korzh, S.; Pan, X.; Garcia-Lecea, M.; Winata, C.L.; Wohland, T.; Korzh, V.; Gong, Z. Requirement of vasculogenesis and blood circulation in late stages of liver growth in zebrafish, BMC Dev Biol, 8 (2008) 84.
[3] Pan, X.; Shi, X.; Korzh, V.; Yu, H.; Wohland, T. Line scan fluorescence correlation spectroscopy for three-dimensional microfluidic flow velocity measurements, J Biomed Opt, 14 (2009) 024049
[4] Shi, X.; Foo, Y.H.; Sudhaharan, T.; Chong, S.W.; Korzh, V.; Ahmed, S.; Wohland, T. Determination of dissociation constants in living zebrafish embryos with single wavelength fluorescence cross-correlation spectroscopy, Biophys J, 97 (2009) 678-686.
[5] Wang, X.; Wohland, T.; Korzh, V. Developing in vivo biophysics by fishing for single molecules, Dev Biol, 347 (2010) 1-8.
[6] Korzh, V.; Wohland, T. Analysis of properties of single molecules in vivo or... why small fish is better than empty dish, Russian Journal of Developmental Biology 43 (2) (2012) 67-76.
[7] Sun, G.; Guo, S.M.; Teh, .; Korzh, V,; Bathe, M.; Wohland, T. Bayesian Model Selection Applied to the Analysis of FCS Data of Fluorescent Proteins in vitro and in vivo, Anal Chem (2015) Apr 21; 87(8): 4326-33.
[8] Teh C, Sun G, Shen H, Korzh V, Wohland T. Modulating expression level of secreted Wnt3 influences cerebellum development in zebrafish transgenics, Development, 2015 Nov 1;142(21):3721-33
[9] Krieger, J.W; Singh, A.P; Bag, N; Garbe, C.S; Saunders, T.E; Langowski, J; Wohland, T. Imaging fluorescence (cross-) correlation spectroscopy in live cells and organisms. Nat Protoc. 2015 Dec;10(12):1948-74.
[10] Wang Y, Wang X, Wohland T, Sampath K. Extracellular interactions and ligand degradation shape the Nodal morphogen gradient. Elife. 2016 Apr 21;5. pii: e13879. doi: 10.7554/eLife.13879. [Epub ahead of print]
[11] Ng XW, Teh C, Korzh V, Wohland T. The secreted signaling protein wnt3 is associated with membrane domains in vivo: a SPIM-FCS study. Biophys J. 2016 Jul 26;111(2):418-29.
[12] Sezgin E, Azbazdar Y, Ng XW, Teh C, Simons K, Weidinger G, Wohland T, Eggeling C, Ozhan G. Binding of canonical Wnt ligands to their receptor complexes occurs in ordered plasma membrane environments. FEBS J. 2017 Jun 19.
[13] Wang J, Yin Y, Lau S, Sankaran J, Rothenberg E, Wohland T, Meier-Schellersheim M, Knaut H.Anosmin1 Shuttles Fgf to Facilitate Its Diffusion, Increase Its Local Concentration, and Induce Sensory Organs. Dev Cell. 2018 Sep 24;46(6):751-766.e12. doi: 10.1016/j.devcel.2018.07.015

